<!-- Facebook Pixel Code --> <script> !functionundefinedf,b,e,v,n,t,s) {ifundefinedf.fbq)return;n=f.fbq=functionundefined){n.callMethod? n.callMethod.applyundefinedn,arguments):n.queue.pushundefinedarguments)}; ifundefined!f._fbq)f._fbq=n;n.push=n;n.loaded=!0;n.version='2.0'; n.queue=[];t=b.createElementundefinede);t.async=!0; t.src=v;s=b.getElementsByTagNameundefinede)[0]; s.parentNode.insertBeforeundefinedt,s)}undefinedwindow, document,'script', 'https://connect.facebook.net/en_US/fbevents.js'); fbqundefined'init', '354966008428866'); fbqundefined'track', 'PageView'); </script> <noscript><img height="1" width="1" style="display:none" src="https://www.facebook.com/tr?id=354966008428866&ev=PageView&noscript=1" /></noscript> <!-- End Facebook Pixel Code -->

Monday, February 18, 2019

Nifty could bounce back with immediate trading range of 10,700-11,000


Last week, market breadth was largely in favour of bears and selling pressure was witnessed in every sector. Market is trading below its three major simple moving averages 20 DMA, 50 DMA and 200 DMA which are placed between 10,820 and 10,850 levels, suggesting strong resistance zone on the higher side.
Middle regression line of linear regression channel is placed around 10,850 levels, while a normal bounce back towards this strong confluence zone is awaited.
Majority of the momentum oscillators are in oversold zone creating the possibility of a bounce back.
Nifty has taken support from the lower support trend line of broadening wedge pattern which is in making since last two months, and mid-point of it is around 10,840 and any decisive move below the crucial support of 10,640 will push it at lower towards 10,500-10,350 levels.
At the same time volatility index, VIX has closed below 16 marks. Moreover, a decisive move above the stiff resistance of 10,860 will push it higher towards previous swing high 10,985.
Looking at the derivative structure, highest Open Interest (OI) in Put is seen around 10,700 strikes whereas maximum Open Interest (OI) in Call is around 11,000 levels, followed by 11,200. Option data indicates an immediate trading range between 10,700 and 11,000 marks.
Source:https://www.moneycontrol.com/news/business/markets/nifty-could-bounce-back-with-immediate-trading-range-of-10700-11000-3547971.html
If you need more information about the Stock Market:

Visit: http://www.tradeindiaresearch.com

Market to remain volatile till general election, invest in phased manner in select companies


The outcome of general elections in May is seen as the biggest local event that will set a direction for markets. Until then, equity gauges are expected to react to progress on global developments such as Brexit and US-China trade talks.
Foreign portfolio investors have pumped in a net of $767.77 million into Indian equities so far in February.
In a key economic development, India's merchandise trade deficit widened to $14.73 billion in January after hitting a 10-month low of $13.08 billion in December, data released by Commerce Ministry showed. The deficit was $15.67 billion in January 2018. Merchandise exports grew 3.74 percent on year to $26.36 billion, mainly due to growth in textiles, drugs and pharmaceuticals as well as organic and inorganic chemicals.
The Reserve Bank of India has warned Yes Bank of regulatory action for making public its report on divergence in violation of the confidentiality clause, the private sector lender said on February 15. The private sector lender in a press release earlier this week had said the RBI did not find any divergence in the asset classification and provisioning done by the lender during 2017-18.
In a regulatory filing on February 15, Yes Bank said it has received a letter from the RBI that noted that the Risk Assessment Report (RAR) was marked 'confidential' and it was expected that no part of the report be divulged except for the information in the form and manner of disclosure prescribed by regulations.
"Therefore, the press release breaches confidentiality and violates regulatory guidelines. Moreover, NIL divergence is not an achievement to be published and is only compliance with the extant Income Recognition and Asset Classification norms," the RBI said in its letter. This may adversely impact the stock price in the coming week.
Globally, all eyes would be on ongoing tussle between the US and China. The recent slowdown in China’s economic growth is also a cause of concern for global investors. Growing confidence that the United States and China will resolve their ongoing trade dispute will help boost global investor sentiments. Those talks will restart next week in Washington, with both sides saying this week's negotiations in Beijing showed progress. Clarity on Brexit would also act as a key trigger for investor interest.
Source:https://www.moneycontrol.com/news/business/markets/market-to-remain-volatile-till-general-election-invest-in-phased-manner-in-select-companies-3548021.html

If you need more information about the Stock Market:

Visit: http://www.tradeindiaresearch.com 

Nifty below 10,700, Sensex down over 100 pts; DHFL gains 6%

Market Opens: It is a flat start for the benchmark indices on Monday with Nifty holding above 10,700 mark.
The Sensex is up 38.58 points at 35847.53, while Nifty is up 6.60 points at 10731. About 460 shares have advanced, 395 shares declined, and 52 shares are unchanged. 
L&T, Rel Infra, Reliance Capital, Biocon, Tata Steel, Infosys, Vedanta, Dr Reddy's Lab, Tech Mahindra, Wipro, ONGC, are among major gainers, while losers are Yes Bank, Tata Motors, HUL, M&M, UPL and Grasim.
Rupee Opens: The Indian rupee opened lower at 71.31 per dollar on Monday versus Friday's close 71.22.
Source:https://www.moneycontrol.com/news/business/markets/stock-market-live-updates-bse-nse-nifty-below-10700-sensex-down-over-100-pts-dhfl-gains-6-3549371.html

If you need more information about the Stock Market:

 Visit: http://www.tradeindiaresearch.com

Opening Bell


If you need more information about the Stock Market:

Visit: http://www.tradeindiaresearch.com 

Saturday, February 16, 2019

Small & midcap buzzers: FIIs, DIIs raised stake in five stocks consistently in 2018


In the third quarter of FY19, foreign institutional investors (FIIs) have been net sellers in the Indian equity market.
Out of the 425 BSE companies that have made public their shareholding data, 256 have reported FIIs to be sellers and only 169 companies have seen FIIs to be net buyers, Narnolia Securities said in a report.
“The net selling by FIIs had been on the backdrop of volatile crude price and depreciating rupee. The strengthening dollar and rising US yields also aided the cause. DIIs (domestic institutional investors), on the other hand, have increased stakes in 263 companies and decreased stakes in 172 companies in Q3 2019,” the report said.
Meanwhile, foreign investors raised their stake consistently in as many as five companies mostly from the small & midcap space, which are — HOEC, Mangalore Refinery & Petrochemicals, Minda Corporation, NHPC and Sundaram-Clayton.

Source:https://www.moneycontrol.com/news/business/markets/small-midcap-buzzers-fiis-diis-raised-stake-in-five-stocks-consistently-in-2018-3536691.html

If you need more information about the Stock Market:

 Visit: http://www.tradeindiaresearch.com 

Friday, February 15, 2019

Indices close off day's low with Nifty above 10,700; metal, pharma stocks under pressure

Market at close: Benchmark indices registered strong recovery from the day's low point with Nifty able to close above 10,700 level.
The Sensex was down 67.27 points at 35808.95, while Nifty was down 21.60 points at 10724.40. About 911 shares have advanced, 1581 shares declined, and 136 shares are unchanged. 
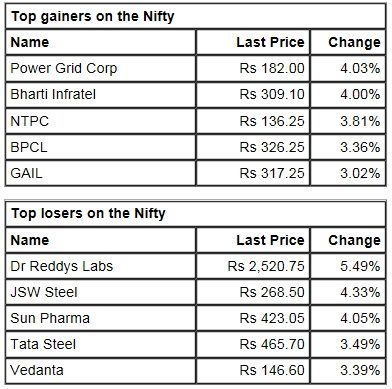
BPCL, Power Grid, NTPC, GAIL and Bharti Infratel are the top gainers, while JSW Steel, Sun Pharma, Dr Reddy’s Labs, Indiabulls Hsg and Tata Steel are among major loser on the Nifty.
Among the sectoral indices pharma, metal, auto and FMCG witnessed selling pressure, while some buying was seen in energy and infra space.

Source:https://www.moneycontrol.com/news/business/markets/closing-bell-indices-close-off-days-low-with-nifty-above-10700-metal-pharma-stocks-under-pressure-3540771.html

If you need more information about the Stock Market:

 Visit: http://www.tradeindiaresearch.com 
Nifty forms 'Bearish Belt Hold' pattern on weekly charts, tread with caution


The Nifty50 managed to trim losses in the second half and closed off day's low amid weak Asian cues on Friday, but the broader markets caught in complete bear trap as the Nifty Midcap and Smallcap indices were down a percent each.
The index registered a bearish candle, which resembles a Hammer kind of formation on the daily charts and 'Bearish Belt Hold' pattern on the weekly scale.
Hammer formations on daily charts should have bullish connotations for the near term, but traders need to be cautious as weakness on weekly charts is getting more pronounced, experts said.
A 'Bearish Belt Hold' pattern is formed when the opening price becomes the highest point of the trading day (intraday high) and the index declines throughout the trading day making up for the large body. The candle will either have a small or no upper shadow and a small lower shadow.
A Hammer which is a bullish reversal pattern is formed after a decline while a Hanging Man is a bearish reversal pattern. A Hammer consists of no upper shadow, a small body, and long lower shadow. The long lower shadow of the Hammer signifies that it tested its support where demand was located and then bounced back.
The Nifty50 after opening moderately higher managed to hit an intraday high of 10,785.75 in early trade itself, but immediately bears took the control of Dalal Street and the index fell up to 10,620.40 in afternoon, followed by a bit of recovery in second half of session. The index cut down losses and closed down 21.60 points at 10,724.40.
"It was heartening to see Nifty50 staging a pull back move from the critical supports, placed around 10,600, as it recouped all the intraday losses which resulted in a Hammer kind of formation with a long lower shadow but weekly charts depicted a Bearish Belt Hold formation as Nifty continued to remain under pressure throughout the week from the highs of 10,930," Mazhar Mohammad, Chief Strategist – Technical Research & Trading Advisory, Chartviewindia.in told Moneycontrol.
He said usually Hammer formations on daily charts should have bullish connotations for the near term provided in the immediate session market witness a follow through buying.
In such a scenario sustaining above 10,700 levels on closing basis Nifty should ideally target 10,900 levels, he added.
Source:https://www.moneycontrol.com/news/business/markets/technical-view-nifty-forms-bearish-belt-hold-pattern-on-weekly-charts-tread-with-caution-3544931.html

If you need more information about the Stock Market:

 Visit: http://www.tradeindiaresearch.com

Closing Bell: Sensex ends 192 pts lower, Nifty below 11,600 even as RBI cuts rate

Market at close:  Benchmark indices ended lower but off day's low after Reserve Bank of India (RBI) slashed repo rate by 25 bps to 6...